The RIAA correction curve

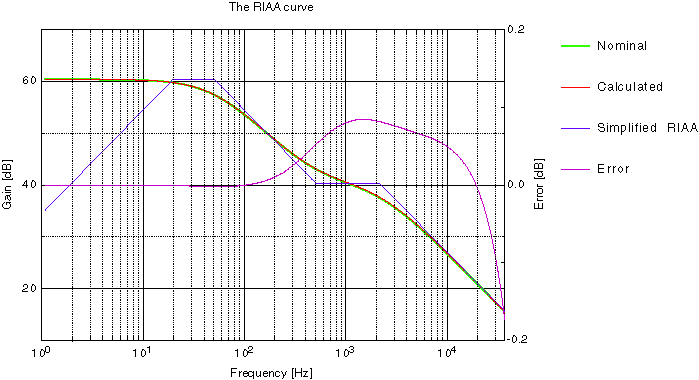
The diagram above shows the nominal and the calculated RIAA curve. The green curve is invisible because it lies almost exactly on top of the red one. If you look at the error curve, down below, you see why.
The diagram above shows the response curves for both RIAA equalization, and the IEC modified version. The latter was not very popular, maybe because it represented a loss of bass (-3 dB ref RIAA at 20 Hz) or was it introduced too late?
RIAA time constants
The time constants that provide RIAA equalization are:
Low Frequency = 3180 us (50.05 Hz)
Mid Frequency = 318 us (500.5 Hz)
High Frequency = 75 us (2122 Hz)
The RIAA-amp has a 'not very flat' frequency response. The reason for this is purely mechanical and exists to give both the cutter and the pickup a fair chance the do their job. The cutter is like a microphone or a loudspeaker. If you apply constant voltage to a loudspeaker you will notice that the movement (amplitude) of the cone is constant below the resonance frequency and above it, it is reversed proportional. If you double the frequency the movement will be half.
With this in mind, the grooves will get gigantic for bass tones and microscopical for the high ones. If you make the grooves very small they will be very sensitive for dust.
The first time constant at 50 Hz is to limit the cutters and the pickups movements in the low bass region below 50 Hz. Above 50 Hz the groove is cut with constant mechanical amplitude. The cutter has a resonance at 500 Hz. That is why the second time constant is at 500 Hz.
The 500 Hz knee suppresses the cutters resonance but you have still the dust problem. At 2122 Hz you will increase the treble and again cut the grooves with constant amplitude. This simple filter acts like a simple noise reduction.
If you remember the lessons from the schooldays you know that the output voltage is proportional to velocity. If the needle moves with a certain amplitude at 200 Hz and moves the same amplitude at 400 Hz you will get twice the output voltage. The signal increases with 6 dB/octave. This leaves us to design an amplifier with a filter that cut all frequencies with 6 dB/octave. But in the lowest region you don't have to cut.
It is this rather large amount of bass boost that accentuates the mechanical noise of a turntable, producing what is commonly known as "rumble". There is also the risk of low frequency feedback if the turntable is not capable of isolating the platter and tone-arm from the listening room environment. Timber floors and rigid suspension increase the risk of feedback.
The RIAA error curve

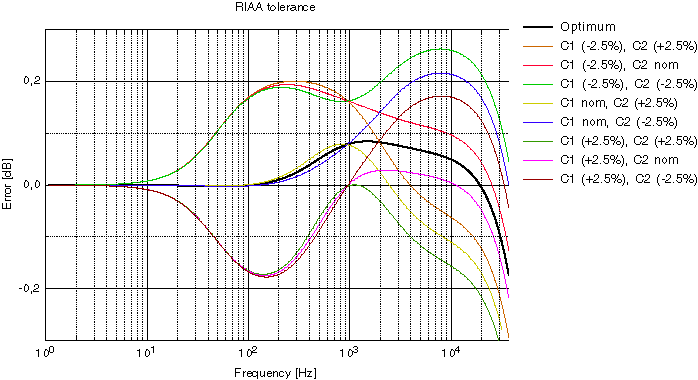
The diagram above shows the nominal error (black) and the maximum of the calculated RIAA curve. Valid for MM (moving magnet) mode.

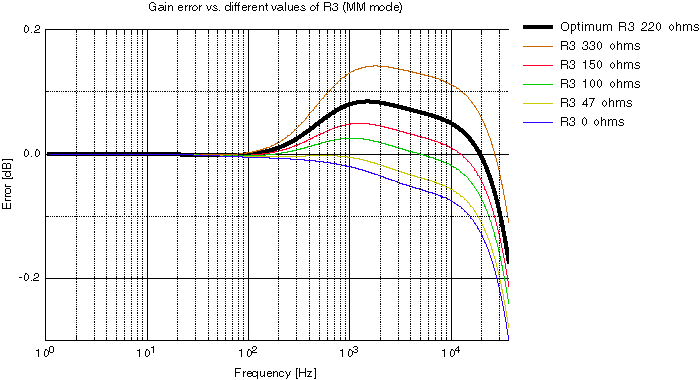
The diagram above shows the error with different values of R3, resistor which limits the lowest gain. Valid for MM (moving magnet) mode.

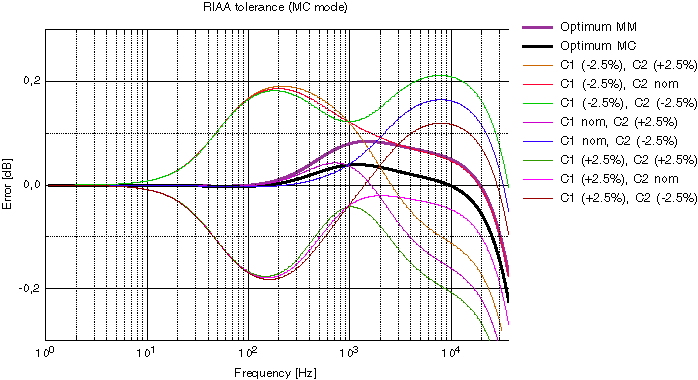
The diagram above shows the nominal error (black) and the maximum of the calculated RIAA curve. Valid for MC (moving coil) mode.
It's quite easy to achieve a very accurate RIAA correction curve. If you use 2,5% capacitors you should statistically achieve a very accurate RIAA-curve. I think the maximum error will be 0,2 dB and the typical less than 0,1 dB. I have derived the formulas and put them into a spreadsheet. Send me a mail if you want this Excel-file (version 8, Office 98). The nice diagrams above are made by the excellent program 'pro Fit' from QuantumSoft, www.quansoft.com.
The formulas are written with the freeware MathMagic from www.mathmagic.com

The simplified RIAA amp look like this. R4 together with R1+R2+R3 determines the DC-gain.
More text to come......
